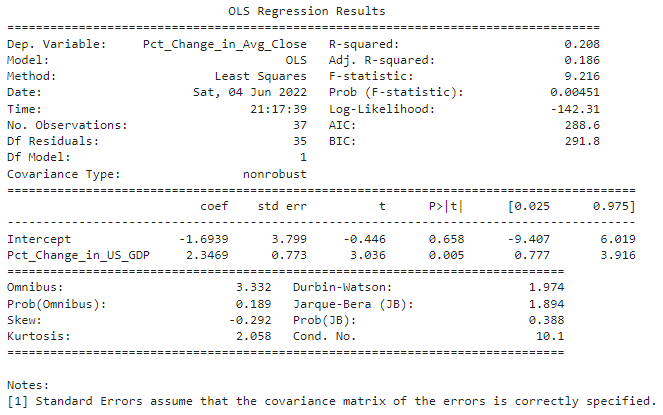
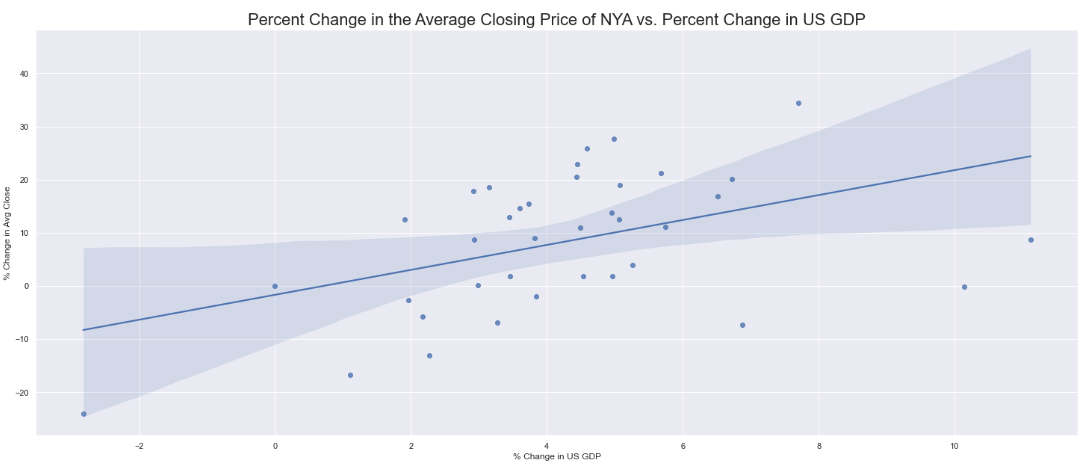
Using Python and its various libraries
This is a project that I worked on during the 2022 Spring quarter in the course COGS 108: Data Science in Practice at UC San Diego. In this course, I worked on a team with four other students to develop, research, and give conclusions to our own research question. Our research question involved determining the relationship between the price of the New York Stock Exchange (stock index NYA) and various metrics of US economic performance between 1980 to 2016.
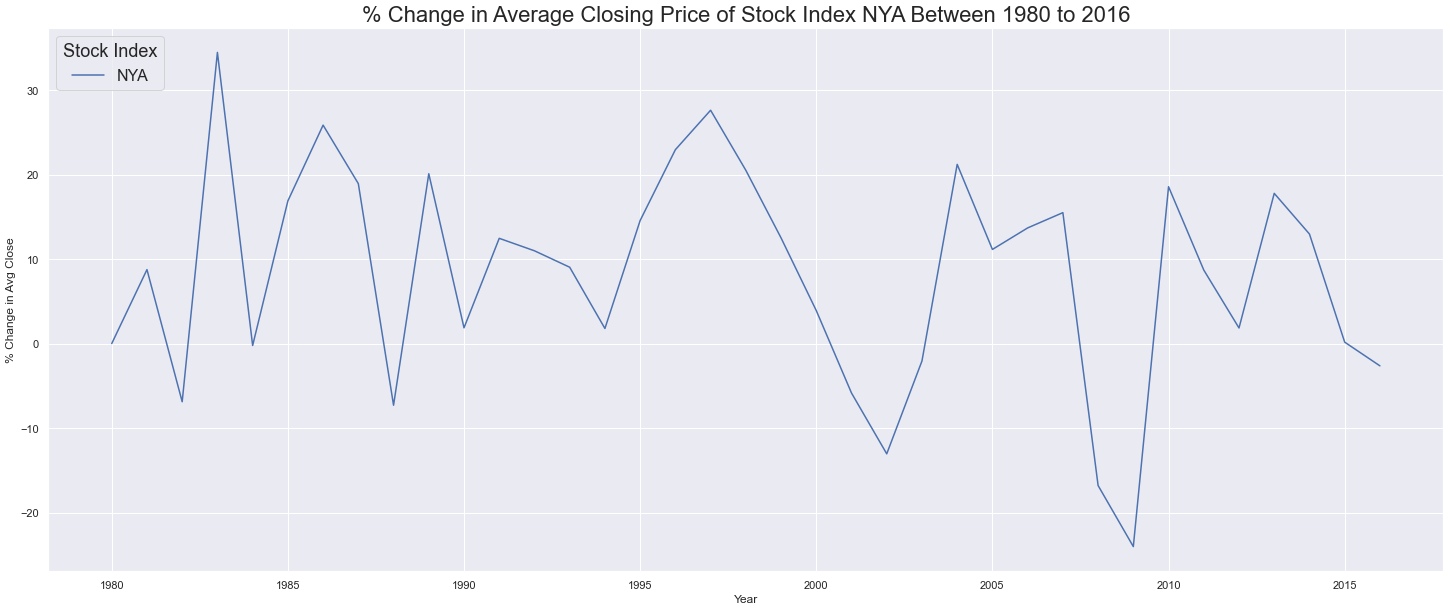
The metrics of US economic performance that our team decided to use were GDP, real GDP, inflation rate, unemployment rate, and effective federal funds rate in the US between 1980 to 2016.
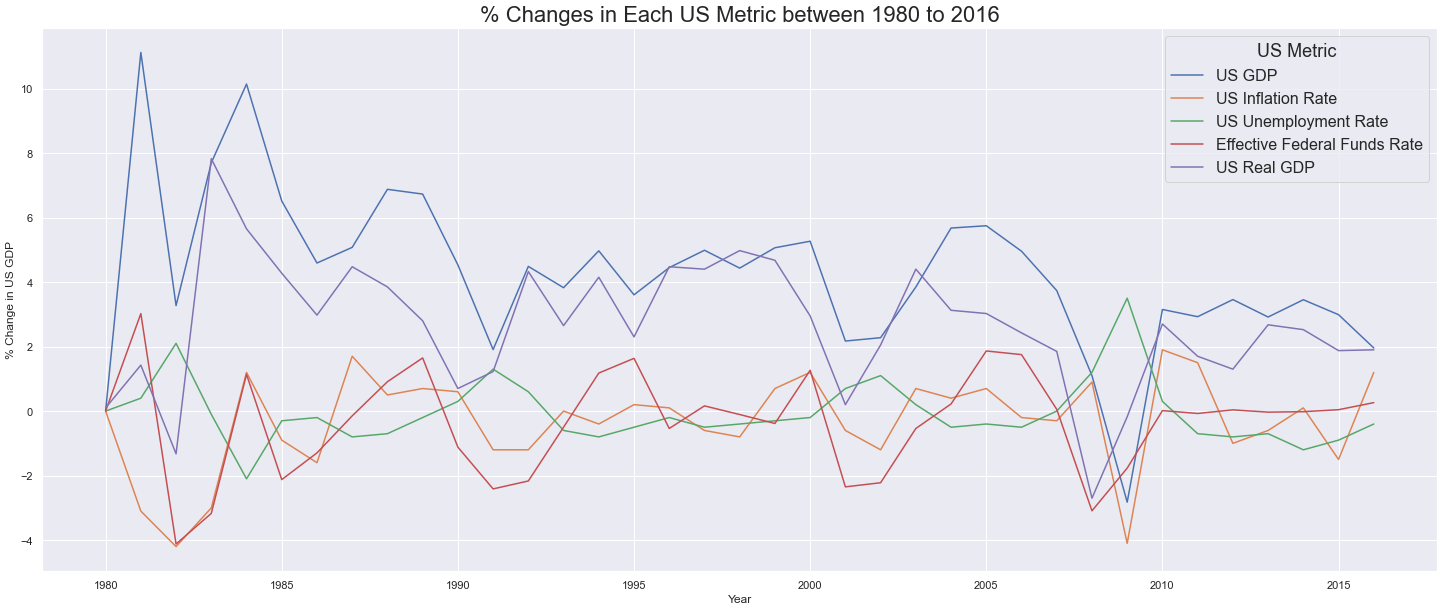
In order to obtain the data in the visualizations above, our team needed to clean the NYA price history dataset and various datasets pertaining to the economic performance of the US. I was one of the members that was primarily involved in cleaning and wrangling each of these datasets using the pandas and NumPy libraries from Python.


I was also involved in data visualization, constructing various plots using the Seaborn and Matplotlib libraries from Python. Additionally, I generated the regression tests between the price of NYA and each of the US metrics between 1980 to 2016 in order to infer the strength of a linear relationship between the variables.
